Commercial airlines operated 38.7 million flights in 2025. IATA classified 51 of them as accidents, including eight fatal accidents.
The overall accident rate improved from 1.42 accidents per million flights in 2024 to 1.32 in 2025. Fatalities moved in the opposite direction. Eight accidents resulted in 394 deaths on board aircraft, the highest annual total since 2018. Another 35 people died on the ground or in other circumstances connected with those accidents.
Two crashes caused most of the increase. Air India Flight 171 and the collision near Washington Reagan National Airport accounted for more than 77% of all onboard fatalities recorded by IATA in 2025. A small number of severe accidents can therefore make one year look much worse even when the overall accident rate falls.
Different organisations publish different totals. IATA counted 51 accidents under its commercial airline criteria, while the Flight Safety Foundation’s Aviation Safety Network counted 101 accidents involving aircraft certified to carry more than 14 passengers. Neither figure is necessarily wrong. The datasets cover different aircraft, operations and accident definitions.
Key Air Travel Safety Stats
- Airlines operated approximately 38.7 million commercial flights in 2025.
- IATA classified 51 flights as accidents, down from 54 in 2024.
- The global accident rate fell from 1.42 to 1.32 accidents per million flights.
- That equals roughly one accident for every 759,646 flights.
- About 99.9999% of flights did not result in an event meeting IATA’s accident criteria. This is calculated from IATA’s flight and accident totals.
- Eight IATA-classified accidents were fatal in 2025, compared with seven in 2024.
- The five-year average for 2021–2025 was six fatal accidents per year.
- IATA recorded 394 onboard fatalities in 2025, up from 244 in 2024.
- Another 35 fatalities were classified as other fatalities, including people on the ground.
- The five-year average was 198 onboard fatalities per year.
- The fatality risk rate increased from 0.06 to 0.17 per million flights.
- The long-term fatality risk rate fell from 0.69 in 2005 to 0.17 in 2025.
- The overall accident rate fell from 3.72 per million flights in 2005 to 1.32 in 2025.
- The five-year rolling fatal accident rate equalled approximately one fatal accident per 5.6 million flights during 2021–2025.
- A decade earlier, the equivalent five-year rate was one fatal accident per 3.5 million flights.
- Jet aircraft recorded an accident rate of 1.03 per million flights, down from 1.23 in 2024.
- Turboprop aircraft recorded 4.08 accidents per million flights, up from 3.22.
- IATA member airlines recorded an accident rate of 0.72 per million flights.
- Non-IATA airlines recorded a rate of 3.09 accidents per million flights.
- Airlines on the IOSA registry recorded 0.98 accidents per million flights, compared with 2.55 for non-IOSA operators.
- Europe recorded 11 accidents and an accident rate of 1.30 per million flights.
- Europe’s IATA fatality risk rate was zero in 2025.
- North America recorded 16 accidents, more than any other IATA region.
- Africa’s accident rate improved from 12.13 to 7.86 per million flights but remained the highest regional rate.
- Tail strikes were the most frequent non-fatal IATA accident category, with nine accidents.
- Landing gear events and runway excursions remained among the most frequent accident categories.
- IATA recorded no loss-of-control-in-flight accidents in 2025.
- Airport facilities contributed to 16% of IATA-classified accidents.
- The broader Aviation Safety Network dataset counted 101 commercial airliner accidents, down 28% from 2024.
- ASN counted 12 fatal airliner accidents, compared with 15 in 2024.
- Turbulence appeared in 26 ASN airliner accidents, down from 35 in 2024.
- The FAA received more than 100 reports of drones near airports each month.
- U.S. pilots reported 10,994 laser strikes in 2025, 14% fewer than in 2024.
- IATA data showed a 220% increase in GPS signal-loss events between 2021 and 2024.
How Safe Is Air Travel Today?
Commercial flying remained statistically safe in 2025, even though several major accidents received worldwide attention.
IATA recorded one accident for approximately every 759,646 flights. Using the same data, around 99.9999% of commercial sectors ended without an event meeting IATA’s definition of an accident. That doesn’t mean every flight was free from technical faults, turbulence, delays or precautionary diversions. Most reported aviation occurrences never become accidents.
Global Commercial Aviation Safety Performance
| Safety measure | 2024 | 2025 | 2021–2025 average |
|---|---|---|---|
| Flights | 37.9 million | 38.7 million | 34.5 million |
| Total accidents | 54 | 51 | 44 |
| Accidents per million flights | 1.42 | 1.32 | 1.27 |
| Fatal accidents | 7 | 8 | 6 |
| Onboard fatalities | 244 | 394 | 198 |
| Fatality risk | 0.06 | 0.17 | 0.12 |
| Jet accident rate | 1.23 | 1.03 | 0.98 |
| Turboprop accident rate | 3.22 | 4.08 | 3.70 |
The table uses IATA’s classification and exposure data. Other organisations may report higher totals because they include smaller aircraft, non-scheduled operations, aircraft outside IATA’s weight criteria or events that IATA excludes from its accident definition.
The overall rate improved slightly in 2025. The number of deaths increased because a few accidents had unusually severe outcomes. Air India Flight 171 caused 241 onboard deaths and 19 other fatalities. The collision near Washington Reagan National Airport caused 64 onboard deaths and three other fatalities.
That distinction matters. Accident frequency measures how often qualifying accidents occur. Fatality risk reflects the severity of those accidents and the proportion of people on board who die. One catastrophic crash can sharply change the second measure without changing the first by much.
Jet operations performed better than turboprop operations in IATA’s 2025 dataset. Jets recorded 1.03 accidents per million sectors, while turboprops recorded 4.08. Aircraft type alone doesn’t explain the difference. Turboprops often operate on shorter routes, at smaller airports and in regions with more varied infrastructure and oversight.
How Many Aviation Accidents Occur Each Year?
There is no single universal accident total. The answer depends on what counts as an aircraft, an airline and an accident.
IATA’s 2025 report covers commercial operations involving jet and turboprop aircraft that meet its operational and weight criteria. It recorded 51 accidents among 38.7 million flights.
The Flight Safety Foundation used the Aviation Safety Network database and counted 101 accidents involving commercial airliners certified for more than 14 passengers. Its total includes older piston-powered aircraft used on some passenger and cargo services.
Why the 2025 Accident Totals Differ
| Dataset | Accidents | Fatal accidents | Onboard fatalities | Main scope |
|---|---|---|---|---|
| IATA | 51 | 8 | 394 | Commercial jet and turboprop operations meeting IATA criteria |
| Flight Safety Foundation / ASN | 101 | 12 | 420 | Commercial aircraft certified for more than 14 passengers |
ASN also recorded 33 deaths on the ground, while IATA classified 35 deaths as other fatalities. The totals differ partly because the organisations apply separate inclusion and classification rules.
The broader ASN total fell by 28% from 140 accidents in 2024 to 101 in 2025. Fatal accidents declined from 15 to 12. Despite those reductions, onboard fatalities increased from 268 to 420.
Annual fatalities fluctuate much more than annual accident rates. A year containing several survivable runway events may produce many accidents but few deaths. A year containing one or two high-capacity aircraft crashes can produce a lower accident count but hundreds of fatalities.
The five-year figures give a better indication of the underlying trend. IATA’s rolling accident rate averaged 1.27 per million flights between 2021 and 2025. Its rolling fatal accident rate improved from one fatal accident per 3.5 million flights in 2012–2016 to one per 5.6 million in 2021–2025.
What Causes Most Aviation Incidents?
Aviation accidents rarely have one simple cause.
Statements claiming that “pilot error causes 50% or 60% of crashes” flatten a chain of events into one label. Investigations may identify training, fatigue, weather, aircraft design, maintenance, airport infrastructure, air traffic control, company procedures and crew decisions in the same accident.
IATA therefore classifies accidents by their final outcome or “end state” rather than assigning each accident to one supposed cause.
Most Frequent Non-Fatal IATA Accident Categories in 2025
| Accident category | Number of accidents |
|---|---|
| Tail strike | 9 |
| Landing gear event | 7 |
| Runway excursion | 6 |
| Ground damage | 6 |
| Hard landing | 4 |
| Runway damage | 3 |
| In-flight damage | 3 |
| Off-runway or partial off-runway touchdown | 3 |
| Mid-air collision | 1 |
| Other end state | 1 |
Tail strikes occur when part of the rear fuselage contacts the runway during take-off or landing. Landing gear events include collapses, failures or abnormal gear operation. Runway excursions occur when an aircraft leaves the runway surface during take-off or landing.
The categories with the most accidents weren’t the categories with the most fatalities. Four events placed in IATA’s “other end state” category accounted for 279 onboard deaths. One mid-air collision caused 64 onboard deaths, and one controlled-flight-into-terrain accident caused 48.
“Other end state” doesn’t mean investigators found no cause. IATA uses the category when available information doesn’t support a more precise classification, when an investigation remains open or when the event doesn’t fit another end-state category.
Airport conditions also affect accident severity. IATA found that airport facilities contributed to 16% of accidents in 2025. Runway contamination, poor markings, lighting deficiencies, obstacles and rigid structures inside safety areas can reduce the margin for recovery.
Incident data shows a different pattern from accident data. IATA’s broader occurrence database identified non-powerplant and powerplant system failures as the most frequently reported categories in 2025, followed by bird strikes. Cabin pressurisation problems, smoke and fumes were common within non-powerplant system reports.
A technical failure doesn’t automatically mean the aircraft was close to crashing. Aircraft carry redundant systems, crews train for failures, and operators can divert or return to an airport before a problem becomes critical.
How Does Air Travel Compare to Other Forms of Transportation?
Flying is one of the safest ways to travel long distances, but claims that it is an exact number of times safer than driving should be treated cautiously.
Road, rail and aviation statistics use different denominators. Results change depending on whether risk is measured per journey, hour, kilometre, passenger-kilometre or lifetime exposure. Definitions also vary by country and may include or exclude crew, pedestrians, general aviation and people on the ground.
The UK Department for Transport specifically warns that casualty comparisons between modes require care because accident coverage and injury definitions differ. Its aviation figures include fixed-wing and rotary-wing accidents involving UK-registered aircraft, while road figures cover police-reported accidents on public roads.
What Can Be Compared Reliably?
| Measure | Commercial aviation | Road travel |
|---|---|---|
| Main current safety measure | Accidents or fatalities per million flights | Fatalities per population, vehicle-kilometre or passenger-kilometre |
| 2025 headline figure | 51 IATA accidents across 38.7 million flights | About 19,400 road deaths in the EU |
| Main limitation | Excludes many private and smaller-aircraft operations | Includes many road-user groups and journey types |
The EU recorded approximately 19,400 road deaths in 2025, based on preliminary data. IATA recorded 394 onboard deaths across its worldwide commercial aviation dataset. Those totals show the very different scale of fatalities, but they aren’t a valid rate comparison because they cover different populations, geographic areas and levels of exposure.
Commercial aviation must also be separated from general aviation. Private flying, recreational aircraft, flight training, air taxis and some business aviation operations have different accident rates from scheduled airline services.
Eurostat recorded 91 deaths in EU air accidents involving EU-registered aircraft in 2024. More than 91% occurred in non-commercial operations, while commercial air transport accounted for 3.3%.
The practical conclusion is narrower than many popular statistics suggest: travelling on a scheduled commercial airline exposes a passenger to a very low fatal accident risk. It doesn’t follow that every type of aircraft operation has the same safety record.
Which Regions Have the Best Aviation Safety Records?
Regional accident rates vary, but a one-year ranking can be misleading.
Regions with fewer flights can move sharply after one or two accidents. A zero fatality-risk result means no qualifying passenger deaths occurred in that year’s dataset. It doesn’t mean future risk is zero.
IATA Accident Rates by Operator Region, 2025
| Region of airline registration | Accidents | Accidents per million flights | Fatality risk |
|---|---|---|---|
| North Asia | 1 | 0.16 | 0.00 |
| Middle East and North Africa | 1 | 0.53 | 0.00 |
| Asia-Pacific | 6 | 0.91 | 0.15 |
| Europe | 11 | 1.30 | 0.00 |
| North America | 16 | 1.68 | 0.21 |
| Latin America and the Caribbean | 5 | 1.77 | 0.26 |
| Commonwealth of Independent States | 4 | 2.74 | 0.69 |
| Africa | 7 | 7.86 | 2.19 |
The table classifies airlines according to the region in which the operator is registered. It doesn’t measure the safety of every airport, regulator or airline in that region.
North Asia recorded the lowest accident rate, with one non-fatal tail strike and a rate of 0.16 per million flights. The region’s rate has remained close to that level for several years.
The Middle East and North Africa recorded one runway excursion and an accident rate of 0.53. Its fatality-risk rate has remained at zero since 2019 under IATA’s criteria.
Europe’s accident rate improved from 1.48 in 2024 to 1.30 in 2025. The region recorded 11 accidents but no onboard fatalities included in IATA’s fatality-risk calculation.
North America recorded 16 accidents and a rate of 1.68, up from 1.49. Ground damage and tail strikes were the most common categories. The Washington mid-air collision pushed the regional fatality-risk rate from zero to 0.21.
Africa’s accident rate fell substantially, from 12.13 to 7.86, but remained the highest regional rate. Five of the seven accidents involved turboprop aircraft, and the region’s fatality-risk rate rose to 2.19.
Regional results shouldn’t be used to label every airline from one continent as safe or unsafe. Airline audit status, regulatory oversight, aircraft type, route network, operating environment and the individual carrier’s record provide more useful information.
What About Turbulence, Drones, and Other Emerging Risks?
Turbulence
Turbulence remains a leading source of injuries in non-fatal airline accidents. The Aviation Safety Network identified turbulence in 26 airliner accidents during 2025, down from 35 in 2024. It remained the most frequently cited ICAO occurrence category in the ASN dataset for the fourth consecutive year.
Turbulence rarely causes modern airliners to lose structural control. The main risk is injury inside the cabin, particularly to passengers or crew who aren’t restrained.
Moderate turbulence can cause injuries too. An NTSB study cited by the FAA found that 44.1% of reviewed turbulence accidents involved severe turbulence and 41.4% involved conditions reported as moderate.
The simplest passenger precaution is to keep the seat belt fastened whenever seated, including when the sign is off. Unexpected clear-air turbulence may provide little warning.
Drones Near Airports
The FAA receives more than 100 reports of drones near U.S. airports each month. Reports can come from pilots, police officers or members of the public, and not every sighting is independently confirmed as a drone.
An unauthorised drone can force an airport to suspend departures or arrivals while authorities assess its location. Regulators are testing detection systems, but those systems must not interfere with aircraft navigation or airport equipment.
EASA also reports increasing numbers of occurrences involving unmanned aircraft as drone use expands. Most reports don’t result in collisions, but safe integration into controlled airspace remains a regulatory priority.
GPS Jamming and Spoofing
Interference with satellite navigation has become a regular operational problem near several conflict zones.
Jamming blocks or degrades satellite signals. Spoofing supplies false position or timing information to the aircraft’s receiver. Pilots can use inertial systems, ground-based navigation aids and air traffic control support when satellite data becomes unreliable.
IATA recorded a 220% increase in GPS signal-loss events between 2021 and 2024. Reports have concentrated around Eastern Europe, the Baltic Sea, the Black Sea and the Middle East, although incidents have also occurred elsewhere.
EASA, IATA and Eurocontrol are developing common reporting procedures, backup navigation networks and airspace contingency plans. EASA issued an updated safety bulletin on GNSS interference in July 2026.
Lithium Battery Fires
Phones, laptops, tablets, power banks and electronic cigarettes all contain lithium batteries. Damage, manufacturing defects or overheating can trigger smoke, fire or thermal runaway.
The Flight Safety Foundation identified 101 known lithium battery events involving passenger aircraft in 2025, up from 83 in 2024. The dataset is probably incomplete because reporting practices differ between countries and operators. One 2025 event became what the Foundation described as the first known passenger aircraft hull loss associated with a lithium battery fire.
The FAA advises passengers to place spare batteries and power banks in carry-on baggage, not checked baggage. Cabin crews can detect and respond to smoke faster when a device remains accessible.
Laser Strikes
U.S. pilots reported 10,994 laser strikes in 2025. That was 14% fewer than in 2024, but the total still averaged about 30 reports per day.
Laser exposure can distract, disorient or temporarily blind a pilot during take-off or landing. The FAA has received reports of 337 pilot injuries since it began tracking laser events in 2010.
Cybersecurity
Modern aviation depends on connected aircraft systems, airline networks, airport databases, maintenance software and air traffic infrastructure.
A cyberattack may disrupt operations without directly taking control of an aircraft. Flight planning, check-in, baggage systems, communications and maintenance records all require protection.
European Part-IS rules require covered aviation organisations and authorities to identify, manage and report information-security risks that could affect safety. The requirements began applying to different groups from October 2025 and February 2026.
Conflict Zones
Civilian aircraft may encounter additional risks when military activity occurs near established air routes.
Risks include missiles, air-defence systems, drones, GPS interference and rapidly changing airspace restrictions. IATA has called for close coordination between military and civilian authorities when airspace closes or reopens.
Flight tracking apps may show longer routes because airlines are avoiding affected airspace. A rerouting doesn’t necessarily indicate a new problem with the aircraft or airline. It may be a deliberate safety measure.
Aviation Technology and Safety Improvements
Aviation’s long-term safety gains don’t come from one invention. They come from layers of technology, training, regulation and reporting.
Safety Management and Data Sharing
Airlines use safety management systems to identify hazards before they become accidents. Flight data monitoring can identify unstable approaches, excessive speed, hard landings and other events across thousands of routine flights.
IATA is expanding its Global Aviation Data Management system and Safety Issue Hub to combine accident reports, incident reports and operational data. The aim is to detect patterns before they produce a severe outcome.
Airline and Ground-Handling Audits
The IATA Operational Safety Audit checks airline operational systems against common standards. IOSA-registered airlines recorded 0.98 accidents per million flights in 2025, compared with 2.55 for airlines outside the registry.
Audit participation alone doesn’t guarantee that an airline will never have an accident. It provides a consistent system for checking procedures, training, maintenance control and safety management.
Ground operations receive similar scrutiny. IATA conducted hundreds of ground-handling audits in 2025 and identified documentation, training and management-system gaps across participating stations.
Runway and Airport Design
Runway safety areas give aircraft more space to stop after an overrun. Frangible signs and equipment are designed to break away rather than cause severe structural damage if struck.
IATA’s finding that airport infrastructure contributed to 16% of 2025 accidents has renewed attention on obstacles, runway contamination, markings, lighting and protected safety zones.
Collision and Terrain Warning Systems
Traffic collision avoidance systems warn pilots when another aircraft creates a collision risk. Ground proximity and terrain awareness systems warn crews when the aircraft approaches terrain in an unsafe configuration.
IATA’s current safety priorities include improving collision-avoidance capabilities, terrain databases and satellite-based procedures.
No loss-of-control-in-flight accidents met IATA’s criteria in 2025. It was only the second year in the organisation’s dataset to record that result, after 2020.
Training for Rare Events
Pilots train in simulators for engine failures, rejected take-offs, wind shear, unreliable airspeed, rapid decompression and other events that would be unsafe or impractical to reproduce in an aircraft.
IATA expanded competency-based training guidance during 2025. This approach evaluates how crews use knowledge, communication, workload management and decision-making rather than relying only on repeated manoeuvres.
Cabin crews repeat evacuation and emergency training. The 2025 IATA report highlighted successful evacuations in Busan and Toronto, where crews removed occupants despite fire in one case and an overturned aircraft in the other.
Expert Insights
“Flying is the safest form of long-distance travel.”
IATA Director General Willie Walsh used that description when releasing the 2025 safety results. He also warned that a single accident among almost 40 million flights can materially alter the annual statistics.
“We are no longer just containing GNSS interference, we must build resilience.”
Jesper Rasmussen, EASA Flight Standards Director, made the point when EASA and IATA announced their joint response to increasing satellite-navigation disruption.
“Even one laser strike is too many.”
FAA security official Ben Supko used those words after pilots reported almost 11,000 laser strikes during 2025.
The common point is less dramatic than popular aviation headlines. Safety depends on reporting minor events, investigating serious ones and correcting weaknesses before the same chain of failures appears again.
FAQ: Air Travel Safety
How safe is flying in 2026?
The latest complete annual data covers 2025. IATA recorded 51 accidents among 38.7 million commercial flights, an accident rate of 1.32 per million flights.
Eight accidents were fatal. The five-year average was one fatal accident per approximately 5.6 million flights.
What are the odds of being in a plane accident?
Using IATA’s 2025 data, one accident occurred for roughly every 759,646 commercial flights.
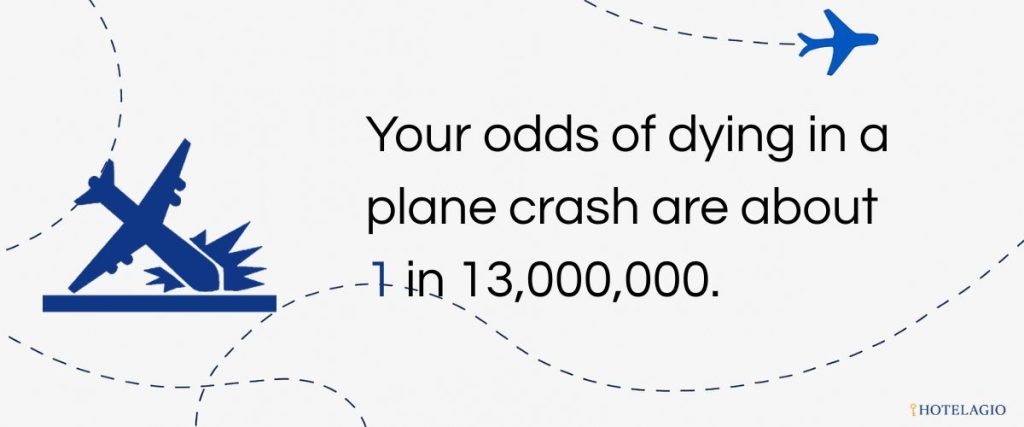
That figure describes the chance that a flight meets IATA’s accident criteria. It isn’t the same as a passenger’s chance of dying. Most accidents are survivable and many cause no passenger deaths.
What are the odds of dying in a plane crash?
There is no single permanent “one in X” figure.
The result depends on the year, country, airline type, aircraft operation, flight distance and whether risk is calculated per flight, passenger, kilometre or lifetime. Five-year and ten-year rates are more useful than a number derived from one year.
IATA’s five-year rolling rate for 2021–2025 was one fatal accident for approximately every 5.6 million flights.
Why do aviation accident totals differ between sources?
IATA, ICAO, EASA and Aviation Safety Network use different aircraft and operational criteria.
IATA counted 51 accidents in 2025. The broader ASN dataset counted 101 accidents involving commercial airliners certified for more than 14 passengers. A number should always be read together with the source’s definition.
How many fatal airline accidents occurred in 2025?
IATA counted eight fatal accidents. The Flight Safety Foundation and Aviation Safety Network counted 12 fatal commercial airliner accidents.
The difference results from their separate inclusion criteria, not necessarily an error in either dataset.
Was 2025 less safe than 2024?
The answer depends on the measure.
The overall IATA accident rate improved from 1.42 to 1.32 accidents per million flights. Fatal accidents increased from seven to eight, while onboard fatalities rose from 244 to 394.
Frequency improved slightly. Severity worsened.
Is turbulence dangerous?
Turbulence can cause serious injuries, particularly when passengers or crew aren’t wearing seat belts.
It rarely threatens the structural safety of a modern commercial aircraft. Keeping the belt fastened whenever seated is the most effective passenger precaution.
Are turboprop aircraft less safe than jets?
IATA’s 2025 accident rate was 4.08 per million turboprop flights and 1.03 per million jet flights.
That doesn’t prove the propulsion system causes the difference. Turboprops often serve smaller airports and operate in conditions that differ from major jet networks.
Which region had the lowest accident rate?
North Asia recorded the lowest IATA regional accident rate in 2025 at 0.16 per million flights.
The Middle East and North Africa followed at 0.53, while Asia-Pacific recorded 0.91. Regional figures can change sharply after one accident, especially where traffic volumes are lower.
Is flying in Europe safe?
Europe recorded 11 IATA-classified accidents in 2025 and an accident rate of 1.30 per million flights. Its fatality-risk rate was zero.
EASA continues to describe Europe as one of the safest aviation regions, while warning that drone integration, new technologies and changing operational risks require continued monitoring.
Are modern aircraft safer than older aircraft?
Modern commercial aircraft benefit from terrain warnings, collision avoidance, improved flight data monitoring, stronger certification standards and more advanced materials.
Age alone doesn’t determine whether an aircraft is safe. An older aircraft maintained and operated under strict standards may present less risk than a newer aircraft operated under weak oversight.
Can one technical failure cause an airline crash?
Commercial aircraft are designed with redundant systems, and crews train to respond to individual failures.
Accidents usually develop from a chain of technical, operational, environmental and organisational factors. Investigators examine how those defences failed or were bypassed rather than stopping at the first visible fault.
What can passengers do to improve their own safety?
Keep the seat belt fastened while seated, follow crew instructions and leave baggage behind during an evacuation.
Carry power banks and spare lithium batteries in cabin baggage. Tell the crew immediately when a device becomes unusually hot, expands, smokes or burns.
Sources
- International Air Transport Association, 2025 Annual Safety Report.
- International Air Transport Association, IATA Releases 2025 Safety Report.
- Flight Safety Foundation, 2025 Safety Report, based on Aviation Safety Network data.
- International Civil Aviation Organization, State of Global Aviation Safety.
- European Union Aviation Safety Agency, Annual Safety Review 2025.
- Federal Aviation Administration, turbulence safety guidance.
- Federal Aviation Administration, lithium battery incident and passenger guidance.
- Federal Aviation Administration, drone sightings near airports.
- EASA and IATA, GNSS interference mitigation plan.
- Federal Aviation Administration, 2025 laser strike statistics.
- UK Department for Transport, modal comparison definitions and limitations.
- European Commission, preliminary EU road fatality data for 2025.

Alison is a travel writer passionate about solo adventures, photography, and memorable getaway escapes. She loves uncovering Cancun’s scenic coastline, boutique stays, local experiences, and hidden gems, creating stories that help curious travelers see more than the usual tourist highlights. Her work has been featured in Forbes, CNN, Travel + Leisure, Yahoo, and other major outlets.