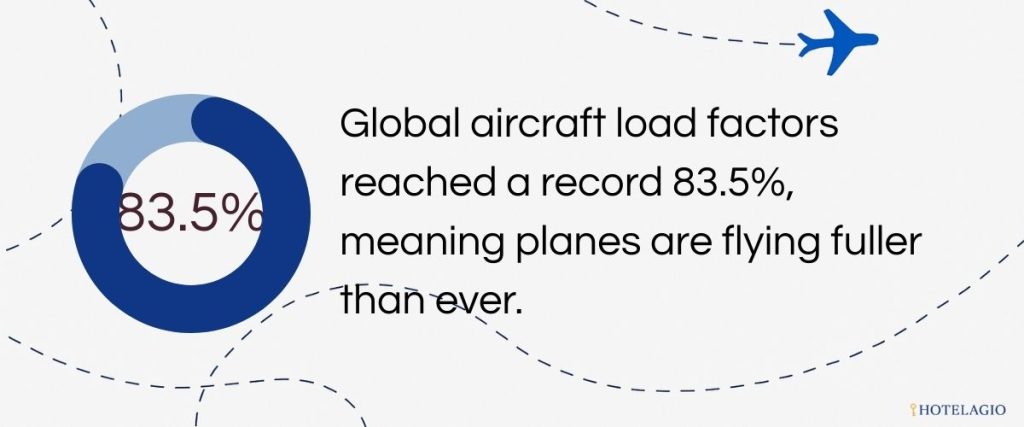
Airlines carried close to 5 billion passenger segments in 2025 and filled a record 83.6% of available seats.
Demand continued to grow, but the financial outlook changed sharply in 2026. IATA now expects airline revenue to reach $1.17 trillion this year, while net profit falls from an estimated $45 billion in 2025 to $23 billion. Higher fuel prices and disruption in the Middle East account for much of the difference.
Passenger numbers require one important distinction. IATA estimates that airlines handled 4.97 billion flight segments in 2025 but 4.26 billion origin-to-destination journeys. A passenger changing planes appears more than once in the segment total but only once in the journey total.
Key Airline Industry Stats
- Airlines carried an estimated 4.97 billion passenger segments in 2025.
- The number of origin-to-destination passenger journeys reached approximately 4.26 billion.
- Airlines operated around 38.9 million scheduled departures during 2025.
- Global passenger demand, measured in revenue passenger kilometres, increased by 5.3%.
- Available seat capacity increased by 5.2%.
- The worldwide passenger load factor reached a record 83.6%.
- International passenger demand increased by 7.1%.
- Domestic passenger demand increased by 2.4%.
- International premium-class travel reached 109.7 million passengers, up 4.5%.
- Premium cabins accounted for approximately 5.5% of international passenger journeys.
- Airline industry revenue reached an estimated $1.065 trillion in 2025.
- Passenger ticket revenue accounted for approximately $768 billion.
- Cargo revenue reached approximately $151 billion.
- Ancillary and other revenue contributed another $146 billion.
- Airlines generated an estimated $45 billion in net profit.
- The industry’s estimated net profit margin was 4.2%.
- Average profit equalled approximately $9.10 per passenger.
- IATA forecasts industry revenue of $1.165 trillion for 2026.
- The 2026 net profit forecast has been cut to $23 billion.
- Expected profit per passenger has fallen to $4.50.
- Fuel costs are forecast to rise from $252 billion to $350 billion.
- Fuel could account for 31.4% of airline operating expenses in 2026.
- Asia-Pacific airlines generated 34.5% of worldwide passenger traffic in 2025.
- European airlines accounted for 26.6%.
- North American airlines accounted for 21.8%.
- Africa recorded the fastest full-year passenger-demand growth at approximately 9.8%.
- North American demand increased by only 0.4%.
- Air cargo demand increased by 3.4% in 2025.
- Airlines carried an estimated 71.5 million tonnes of cargo.
- International air cargo demand increased by 4.2%.
- Asia-Pacific airlines produced the fastest cargo growth at 8.4%.
- Direct airline employment reached approximately 3.30 million jobs.
- Airline labour costs totalled an estimated $260 billion.
- Direct airline employment is forecast to increase to 3.33 million in 2026.
- Aviation as a wider sector supports approximately 86.5 million jobs and $4.1 trillion in economic activity.
- The commercial aircraft order backlog reached approximately 18,100 aircraft in May 2026.
- The backlog was equal to around 60% of the active commercial fleet.
- Supply-chain constraints left the industry with an effective shortage of approximately 3,170 aircraft.
- Sustainable aviation fuel supplied approximately 0.8% of airline fuel demand in 2026.
- SAF production is expected to reach 2.4 million tonnes.
- The price premium for SAF could cost airlines an additional $4.3 billion.
How Many Passengers Travel by Air Each Year?
Airlines carried an estimated 4.97 billion passenger segments in 2025, up from 4.78 billion in 2024.
The number of individual journeys was lower. IATA estimated 4.26 billion origin-to-destination passengers because connecting passengers may take two or more flights during one trip.
Global Airline Passenger Traffic
| Year | Passenger segments | Origin-to-destination passengers | Scheduled departures | Passenger load factor |
|---|---|---|---|---|
| 2019 | 4.56 billion | 3.97 billion | 37.5 million | 82.6% |
| 2023 | 4.41 billion | 3.78 billion | 35.3 million | 82.2% |
| 2024 | 4.78 billion | 4.10 billion | 37.3 million | 83.4% |
| 2025 estimate | 4.97 billion | 4.26 billion | 38.9 million | 83.5–83.6% |
| 2026 forecast | 5.09 billion | 4.34 billion | 38.7 million | 84.0% |
IATA’s June 2026 economic forecast places the 2025 load factor at 83.5%, while its final passenger-demand release reports 83.6%. The difference comes from rounding and revisions between publications.
Passenger traffic grew more slowly in 2025 than during the initial post-pandemic recovery. Revenue passenger kilometres rose by 5.3%, compared with 10.6% in 2024.
International travel produced most of the increase. International demand grew by 7.1%, while domestic demand rose by 2.4%. International capacity expanded by 6.8%, allowing airlines to raise their international load factor to 83.5%.
Premium travel also expanded. Airlines carried 109.7 million international first- and business-class passengers in 2025, 4.5% more than in 2024. Europe was the largest premium market with 39.7 million passengers, while North America recorded the highest premium share at 10.4% of international travel.
IATA expects passenger segments to exceed 5 billion in 2026 for the first time. The current forecast of 5.09 billion represents growth of only 2.4%, partly because geopolitical disruption is reducing traffic in the Middle East.
How Much Revenue Does the Airline Industry Generate?
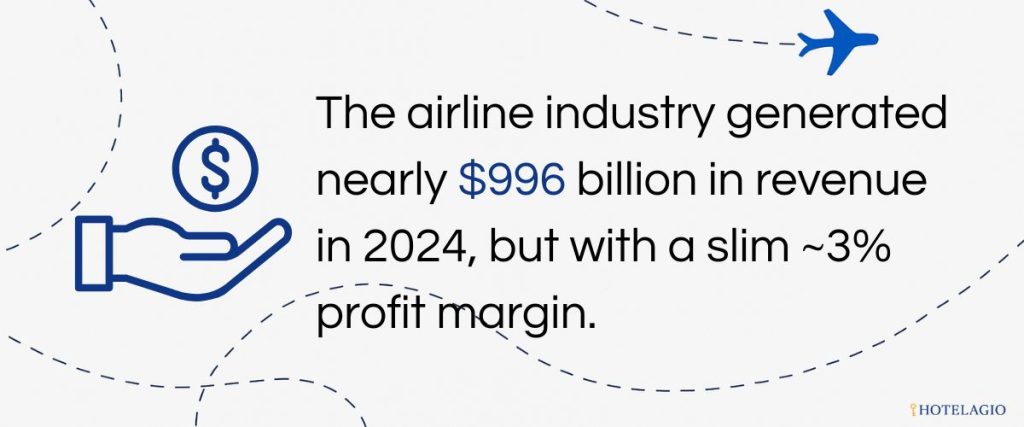
Airline revenue passed $1 trillion in 2024 and continued to rise in 2025.
IATA estimates that airlines generated $1.065 trillion in 2025. Passenger tickets provided 72% of that revenue, while cargo and ancillary services supplied the rest.
Global Airline Industry Financial Performance
| Financial measure | 2024 | 2025 estimate | 2026 forecast |
|---|---|---|---|
| Total revenue | $1.009T | $1.065T | $1.165T |
| Passenger ticket revenue | $726B | $768B | $839B |
| Cargo revenue | $147B | $151B | $162B |
| Ancillary and other revenue | $137B | $146B | $165B |
| Operating expenses | $938B | $989B | $1.117T |
| Fuel costs | $261B | $252B | $350B |
| Operating profit | $70.7B | $76.4B | $48.0B |
| Net profit | $37.7B | $45.0B | $23.0B |
| Net profit margin | 3.7% | 4.2% | 2.0% |
| Profit per passenger | $7.90 | $9.10 | $4.50 |
The 2025 figures remain IATA estimates rather than audited totals for every airline. The 2026 figures are forecasts and may change again as fuel prices, exchange rates and airspace restrictions develop.
Higher revenue won’t mean stronger profitability in 2026. Airlines are expected to collect approximately $100 billion more revenue but earn $22 billion less net profit.
Fuel is the main reason. IATA expects the average jet-fuel price to rise from approximately $90 per barrel in 2025 to $152 in 2026. The industry’s annual fuel bill could increase by $98 billion even though total fuel consumption remains close to 104 billion gallons.
Labour costs are also rising. Airlines spent an estimated $260 billion on employees in 2025 and are expected to spend $271 billion in 2026. Employment is forecast to grow by 1%, but employee productivity may fall slightly.
The industry still operates on narrow margins. A 2% net margin means airlines retain about $2 from every $100 in revenue after expenses. IATA estimates that airline return on invested capital will fall to 4.3% in 2026, well below the industry’s estimated 8.5% cost of capital.
Which Regions Have the Most Air Passengers?
Asia-Pacific airlines generated more passenger traffic than carriers from any other region in 2025. They accounted for 34.5% of worldwide revenue passenger kilometres.
Europe followed with 26.6%, while North America supplied 21.8%. Together, the three regions represented almost 83% of global airline passenger traffic.
Airline Passenger Demand by Region
| Airline region | Share of global RPKs in 2025 | 2025 demand growth | 2026 forecast |
|---|---|---|---|
| Asia-Pacific | 34.5% | +7.7% | +5.1% |
| Europe | 26.6% | +5.3% | +2.8% |
| North America | 21.8% | +0.4% | +0.8% |
| Middle East | 9.5% | +6.8% | -11.4% |
| Latin America and Caribbean | 5.4% | +7.2% | +5.0% |
| Africa | 2.2% | +9.8% | +10.0% |
| Worldwide | 100% | +5.3% | +2.1% |
The regional classification follows the airline’s home region rather than the country in which every flight takes place. A European airline operating a route between Europe and Asia remains part of Europe’s total.
Africa recorded the fastest percentage growth in 2025, but it started from a small base. African airlines generated only 2.2% of worldwide passenger traffic.
Asia-Pacific combines size with strong growth. The region accounted for more than one-third of global passenger demand and expanded by approximately 7.7%. China, Japan and India remained among the ten largest passenger markets.
North America produced the weakest growth. Demand increased by only 0.4% in 2025, and U.S. domestic traffic declined during parts of the year. The region still carries more than one-fifth of global passenger kilometres.
The Middle East faces the sharpest projected decline in 2026. IATA forecasts an 11.4% fall in demand following conflict, airspace closures and reduced connecting traffic. That forecast is highly dependent on how quickly normal operations return.
Largest Passenger Markets by Country
| Rank | Country | Passenger journeys in 2025 | Annual change |
|---|---|---|---|
| 1 | United States | 890.1 million | +1.6% |
| 2 | China | 776.1 million | +4.8% |
| 3 | United Kingdom | 269.7 million | +3.4% |
| 4 | Spain | 252.7 million | +5.0% |
| 5 | Japan | 223.5 million | +9.2% |
| 6 | India | 218.2 million | +3.3% |
| 7 | Italy | 187.3 million | +5.8% |
| 8 | Germany | 163.8 million | +3.4% |
| 9 | France | 152.6 million | +2.2% |
| 10 | Türkiye | 129.3 million | +2.9% |
Domestic journeys count once in the country total. An international journey is counted in both its origin and destination country, so the national figures shouldn’t be added together to calculate a worldwide passenger total.
Which Airlines Carry the Most Passengers?
There is no fully standardised worldwide ranking of airlines by passengers actually carried. Airlines don’t all publish passenger totals using the same definitions, and some count connecting journeys differently.
Scheduled seat capacity provides a more consistent comparison. OAG ranked American Airlines first in 2025 with 279.6 million available seats, followed by Delta, Southwest, United and Ryanair.
Largest Airlines by Scheduled Capacity in 2025
| Rank | Airline | Scheduled seats | Scheduled flights | Available seat kilometres |
|---|---|---|---|---|
| 1 | American Airlines | 279.6 million | 2.3 million | 487.9 billion |
| 2 | Delta Air Lines | 246.9 million | 1.8 million | 483.7 billion |
| 3 | Southwest Airlines | 229.2 million | 1.4 million | 290.8 billion |
| 4 | United Airlines | 225.5 million | 1.7 million | 536.5 billion |
| 5 | Ryanair | 213.1 million | 1.1 million | Not in OAG’s global top five by ASK |
American Airlines led by scheduled seats and flight frequency. United ranked first by available seat kilometres because it operated a larger share of long-distance flights.
Ryanair remained the largest airline outside the United States by scheduled seat capacity. Its 213.1 million seats placed it ahead of major network groups based in Europe, Asia and the Middle East.
Emirates didn’t appear among the five largest airlines by seat count, but it ranked fourth by available seat kilometres with 380.6 billion. Its long-haul network produces far more seat kilometres per flight than a domestic or short-haul carrier.
The same distinction applies to passenger counts. An airline can carry more passengers but generate fewer passenger kilometres if most of its customers fly short routes.
What Are the Most Common Types of Aircraft in Service?
The Boeing 737 remained the most frequently operated commercial aircraft family in 2025. Airlines used different 737 variants for approximately 10.8 million flights.
The Airbus A320 family followed. The A320 operated 8.7 million flights, while the larger A321 completed another 4.2 million.
Most Frequently Used Commercial Aircraft in 2025
| Aircraft family | Flights in 2025 | Change from 2019 |
|---|---|---|
| Boeing 737, all variants | 10.8 million | +3.1% |
| Airbus A320 | 8.7 million | +7.6% |
| Airbus A321 | 4.2 million | +61.6% |
| Embraer E170/E190 family | 2.7 million | +2.8% |
| Airbus A319 | 1.4 million | -34.3% |
| Boeing 787 | 795,000 | +40.8% |
| Airbus A220 | 530,000 | +770.4% |
| Airbus A350 | 434,000 | +117.4% |
| Airbus A380 | 90,000 | -24.4% |
These numbers measure flights operated rather than aircraft in the active fleet. A short-haul aircraft can complete several flights a day, while a long-haul aircraft may complete one.
The A321 recorded the strongest growth among established narrow-body models. Airlines are using the aircraft on both high-density short-haul services and longer routes previously served by wide-body jets.
Newer aircraft families grew from smaller bases. A220 flights were more than eight times higher than in 2019, while A350 operations more than doubled.
The A380 continued to recover from the pandemic but remained below its 2019 activity. Several airlines have returned stored aircraft to service, yet the type completed 24.4% fewer flights than six years earlier.
Aircraft availability remains a constraint. The commercial order backlog reached approximately 18,100 aircraft in May 2026, equal to roughly 60% of the active fleet. IATA estimates that manufacturing and engine problems have left airlines effectively short of about 3,170 aircraft.
The shortage keeps older aircraft in service for longer, raises leasing prices and limits the number of routes airlines can add. IATA estimated that aircraft supply-chain problems added more than $11 billion to airline costs in 2025.
Airline Operations Snapshot
Airlines operated approximately 38.9 million departures during 2025. That was 1.6 million more than in 2024 and 1.4 million more than in 2019.
IATA expects departures to fall slightly to 38.7 million in 2026, even though passenger numbers continue to rise. A higher load factor means airlines can carry more people without operating more flights.
2025 Airline Operations at a Glance
| Operational indicator | Latest figure |
|---|---|
| Scheduled departures | 38.9 million |
| Passenger segments | 4.97 billion |
| Origin-to-destination journeys | 4.26 billion |
| Passenger load factor | 83.6% |
| International premium passengers | 109.7 million |
| Direct airline employees | 3.30 million |
| Airline labour costs | $260 billion |
| Commercial aircraft backlog | 18,100 aircraft |
| Busiest global air route | Jeju–Seoul Gimpo |
| Passengers on Jeju–Seoul Gimpo | 13.3 million |
| Most punctual global airline | Aeromexico |
| Aeromexico on-time performance | 90.02% |
Jeju to Seoul Gimpo remained the busiest airline route, carrying 13.3 million passengers in 2025. All ten of the year’s busiest airport pairs were domestic routes, reflecting the frequency and passenger density of large national markets.
Global scheduled capacity peaked on August 1, when airlines offered approximately 19.83 million seats. January 28 was the quietest day, with 15.20 million seats.
Aeromexico recorded the highest on-time performance among global airlines. Cirium classified 90.02% of its 188,859 tracked flights as arriving on time. On-time performance measures operational reliability, not safety or customer satisfaction.
Airline employment returned above pre-pandemic levels. Carriers directly employed approximately 3.30 million people in 2025 and are expected to add around 30,000 jobs during 2026.
The wider aviation sector is much larger. Airlines, airports, manufacturers, navigation providers and aviation-supported tourism collectively sustain an estimated 86.5 million jobs and $4.1 trillion in economic activity. These figures use 2023 economic-impact data and shouldn’t be confused with direct airline employment.
Air cargo remained an important source of airline income. Demand increased by 3.4% in 2025, while cargo revenue reached an estimated $151 billion.
Asia-Pacific airlines generated 35.9% of worldwide cargo tonne-kilometres and recorded growth of 8.4%. North American cargo demand fell by 1.3%, making it the only region to report a full-year contraction.
Sustainability and Aviation: Emissions, Fuel, and Policy Trends
Aviation produced approximately 882 million tonnes of carbon dioxide in 2023, the latest sector-wide estimate published by the Air Transport Action Group. That equalled about 2.05% of global CO₂ emissions.
International aviation accounted for approximately 1.3% of global emissions and domestic flying for 0.7%. Around 80% of aviation CO₂ came from flights longer than 1,500 kilometres, where rail or road travel is rarely a practical replacement.
Airline Fuel and Sustainability Indicators
| Indicator | 2025 estimate | 2026 forecast |
|---|---|---|
| Airline fuel consumption | 104 billion gallons | 104 billion gallons |
| Total airline fuel cost | $252 billion | $350 billion |
| Fuel share of operating expenses | 25.4% | 31.4% |
| Fuel efficiency | 4.1 litres per 100 passenger-km | 4.0 litres |
| SAF production | 1.9 million tonnes | 2.4 million tonnes |
| SAF share of total fuel | About 0.6% | 0.8% |
| Additional SAF cost | Around $3.6B | $4.3B |
| Estimated CORSIA cost | Limited first-phase cost | $1.2B–$1.6B |
Fuel efficiency continues to improve as airlines introduce newer aircraft, use more seats per flight and retire older models. The forecast reduction from 4.1 to 4.0 litres per 100 passenger kilometres is small but applies across billions of journeys.
Sustainable aviation fuel remains scarce. Production is forecast to reach 2.4 million tonnes in 2026, but that covers only 0.8% of airline fuel demand.
SAF also costs much more than conventional jet fuel. IATA estimates that the premium paid for sustainable fuel will add $4.3 billion to airline expenses in 2026.
The gap between current production and the industry’s 2050 target is large. IATA estimates that aviation could require around 500 million tonnes of SAF per year by 2050 to support its net-zero objective. Current output represents less than 1% of that potential requirement.
Airlines are also beginning to pay more for carbon compliance. IATA expects the Carbon Offsetting and Reduction Scheme for International Aviation, known as CORSIA, to cost airlines between $1.2 billion and $1.6 billion during 2026.
Fleet renewal could reduce fuel use, but aircraft shortages are delaying some efficiency gains. Airlines have kept older aircraft in service because manufacturers and engine suppliers haven’t delivered enough replacements.
Expert Insights
Rising revenue doesn’t guarantee rising profit
The airline industry is expected to generate record revenue in 2026 while earning only half as much net profit as in 2025.
IATA Director General Willie Walsh summarised the pressure directly: “Net profit per passenger is expected to fall to just $4.50.” The expected margin leaves airlines with little protection against another fuel, currency or geopolitical shock.
The aircraft shortage affects fares and route growth
The 18,100-aircraft backlog is more than a manufacturing statistic. Limited supply raises lease costs, keeps fuel-hungry aircraft flying and prevents airlines from adding all the capacity they planned.
Passenger demand can therefore grow faster than the number of flights. That supports high load factors and may keep fares firm on routes where additional aircraft aren’t available.
The fastest-growing market isn’t the largest
Africa recorded the fastest percentage growth in 2025 and is forecast to lead again in 2026. It still represents only 2.2% of global passenger traffic.
Asia-Pacific matters more to the industry’s absolute growth. It combines a 34.5% market share with expanding demand in China, India, Japan and Southeast Asia.
Decarbonisation depends on fuel supply
Airlines have improved efficiency and ordered newer aircraft, but those measures alone won’t deliver net-zero emissions.
SAF is expected to cover less than 1% of fuel demand in 2026. Reaching the volumes discussed for 2050 will require new refineries, long-term investment, reliable feedstocks and policies that increase supply rather than only raising airline costs.
FAQ – Airline Industry Insights
How many people fly every year?
Airlines carried approximately 4.97 billion passenger segments in 2025. The figure counts each individual flight, so a passenger taking two connecting flights appears twice.
The estimated number of origin-to-destination passenger journeys was lower at 4.26 billion. IATA forecasts 5.09 billion flight segments and 4.34 billion complete journeys for 2026.
Which airlines carry the most passengers?
A fully comparable global passenger ranking isn’t available because airlines use different reporting methods.
By scheduled seat capacity, American Airlines ranked first in 2025 with 279.6 million seats. Delta followed with 246.9 million, Southwest with 229.2 million, United with 225.5 million and Ryanair with 213.1 million.
American also operated the most scheduled flights. United ranked first by available seat kilometres because it operated more long-haul capacity.
What is the biggest challenge facing airlines today?
The immediate challenge is the combination of higher fuel costs, geopolitical disruption and limited aircraft availability.
IATA expects the airline fuel bill to rise by $98 billion in 2026. At the same time, a backlog of approximately 18,100 aircraft prevents airlines from replacing older jets or adding all the capacity they need.
Decarbonisation is the longer-term challenge. SAF is expensive and expected to supply only 0.8% of airline fuel in 2026.
How much revenue does the airline industry generate?
IATA estimates that airlines generated $1.065 trillion in 2025.
Revenue is forecast to rise to $1.165 trillion in 2026, including $839 billion from passenger tickets, $162 billion from cargo and $165 billion from ancillary and other services.
How profitable is the airline industry?
Airlines earned an estimated $45 billion in net profit during 2025, equal to a 4.2% margin and $9.10 per passenger.
IATA expects profit to fall to $23 billion in 2026. The forecast margin is 2%, or approximately $4.50 per passenger.
Which region has the fastest-growing airline market?
Africa recorded the fastest passenger-demand growth in 2025 at approximately 9.8%. IATA forecasts another 10% increase in 2026.
Africa remains the smallest airline region, with 2.2% of global demand. Asia-Pacific is the largest growth market in absolute terms because it accounts for 34.5% of worldwide traffic and is forecast to expand by 5.1% in 2026.
How many commercial flights operate each year?
Airlines operated around 38.9 million scheduled departures in 2025.
IATA forecasts 38.7 million departures in 2026. Passenger totals can still grow because airlines are expected to fill 84% of available seats, up from 83.6% in 2025.
What is an airline load factor?
Load factor measures the percentage of available passenger capacity used by paying travellers. It takes both seats and distance flown into account.
The global passenger load factor reached a record 83.6% in 2025. That doesn’t mean every individual aircraft was exactly 83.6% full. It represents the industry-wide relationship between revenue passenger kilometres and available seat kilometres.
How large is the air cargo industry?
Airlines carried an estimated 71.5 million tonnes of cargo in 2025 and earned approximately $151 billion in cargo revenue.
Cargo demand measured in tonne-kilometres increased by 3.4%. IATA forecasts only limited volume growth in 2026, with approximately 71.7 million tonnes carried.
How many people work for airlines?
Airlines directly employed approximately 3.30 million people in 2025. Employment is forecast to reach 3.33 million in 2026.
The wider aviation economy supports an estimated 86.5 million jobs when airports, manufacturing, air navigation, suppliers and aviation-supported tourism are included.
Are airline ticket prices increasing?
IATA’s June 2026 forecast places the average nominal return fare, excluding taxes and surcharges, at approximately $462 in 2026. The comparable 2025 estimate was $429.
The increase reflects fuel costs, constrained aircraft supply and disruption to some long-haul networks. Actual fares vary widely by market, cabin, booking date and route.
Sources
- International Air Transport Association, Global Outlook for Air Transport, June 2026.
- International Air Transport Association, Airline Industry Economic Performance, June 2026.
- International Air Transport Association, Full-Year Passenger Demand for 2025.
- International Air Transport Association, Full-Year Air Cargo Demand for 2025.
- International Air Transport Association, World Air Transport Statistics 2025.
- OAG, Air Travel Statistics 2025.
- Cirium, 2025 On-Time Performance Review.
- Air Transport Action Group, Aviation: Benefits Beyond Borders.
- Air Transport Action Group, aviation emissions and climate data.
- International Air Transport Association, sustainable aviation fuel production and cost outlook.

Alison is a travel writer passionate about solo adventures, photography, and memorable getaway escapes. She loves uncovering Cancun’s scenic coastline, boutique stays, local experiences, and hidden gems, creating stories that help curious travelers see more than the usual tourist highlights. Her work has been featured in Forbes, CNN, Travel + Leisure, Yahoo, and other major outlets.